How to make an honest SEER2 savings report for a customer
Worked methods and examples from Relay. References checked November 13, 2026.
A useful efficiency comparison shows the customer the annual cooling cost under stated assumptions, the price difference between options, and what would change the answer. Start with matched SEER2 ratings and one seasonal cooling load. Keep equipment selection and comfort findings in the estimate; an efficiency calculation does not select a system.
Gather five inputs before quoting savings
Record cooling capacity in Btu/h, each matched system’s SEER2, equivalent full-load cooling hours, the customer’s marginal electricity rate, and the extra installed cost of the proposed option. The AHRI seasonal-efficiency explanation defines the relation between seasonal cooling output and electricity input.
Equivalent full-load hours represent seasonal cooling demand divided by full-load capacity. They are not thermostat hours or compressor run hours: a variable-capacity unit can run longer at lower output. Label a guessed value as a scenario. Do not invent a local annual-hour figure from a state name.
Use both ratings from the same test standard. SEER2 uses revised test conditions; there is no universal conversion that makes an old SEER rating interchangeable with SEER2. If the current system has only SEER, gather appropriate performance information before presenting this worksheet as a comparison.
A 3-ton comparison, with the math visible
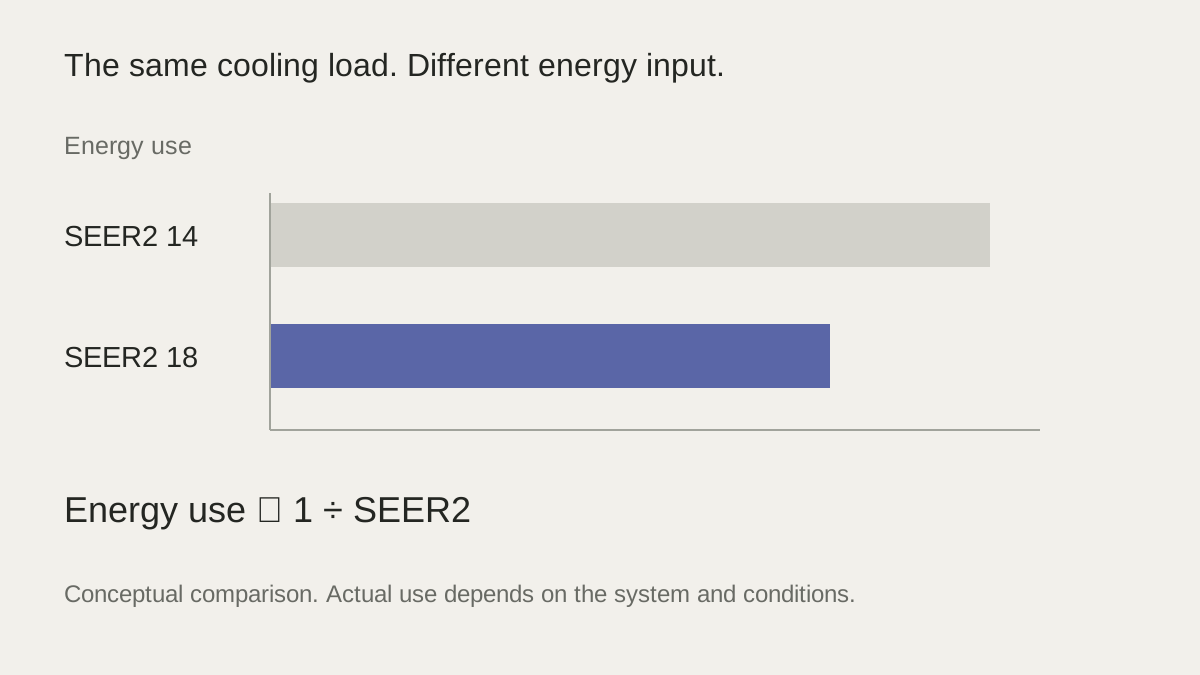
Consider an illustrative 36,000 Btu/h load basis, 1,200 equivalent full-load hours, and 14 versus 18 SEER2. Seasonal cooling output is 43.2 million Btu. Divide by 14 and 1,000 to get 3,085.71 kWh for the current system; divide by 18 and 1,000 to get 2,400 kWh for the proposed system.
At $0.16/kWh the modeled cooling costs are $493.71 and $384.00, a $109.71 annual difference. The reduction is 22.22% of modeled cooling energy, not 22.22% of the whole utility bill. Heating, appliances and other household uses remain outside the calculation.
Use the SEER2 comparison calculator to reproduce this example and download a report with the inputs and method.
Show the assumption that changes the decision
Keep everything else fixed and use 600 full-load hours: annual savings fall to $54.86. At 1,800 hours they rise to $164.57. For a $1,500 upgrade premium, simple payback ranges from about 27.3 to 9.1 years. That range is often more useful than an unsupported single-number promise.
Simple payback excludes financing, discount rates, future rates, maintenance and equipment life. If modeled savings are zero or negative, there is no finite energy-savings payback. A more expensive option may still have comfort or noise benefits, but explain those separately with evidence.
Keep the report beside the actual proposal
Add the customer or project name in the calculator’s report controls and download the PDF. Review the assumptions with the customer. Then use the existing estimate builder for the scope, equipment, installed prices and warranty terms. Send the calculation report alongside the proposal; the report does not become a contract or automatically change an estimate.
The free builder exports locally without signup. Email verification is required to host a customer-approval link. Check all three packages before sharing, particularly any example scope or warranty text.